It’s an ugly word for an ugly phenomenon. ‘Greedflation’ is the new buzzword in economics.
The thesis is quite simple. While a certain chunk of the inflation we’re currently living through can undoubtedly be put down to higher energy prices and a chunk put down to higher wages as employers pass those costs onto their workers, there’s a sizeable chunk that comes back to something else: profits.
Some economists argue that businesses are using the cost of living crisis as an opportunity to generate excessive profits.
This isn’t just an idle theory. Economists at the European Central Bank (ECB) actually have some statistical evidence to back it up.
You can only learn so much by breaking down the consumer price index, the traditional measure of rising prices (inflation, let’s not forget, is simply the rate at which the prices of the average goods and services we spend most of our money on change each year).
That might tell you how much is down to food price inflation but it can’t give you a sense of how much of that given increase in food prices is benefiting workers versus their employers.
But there is another way of skinning the numbers. You can look instead at another measure of prices, something called the gross domestic product deflator.
Looking at prices this way, via another dataset, allows you to work out how much of the pricing pressure we’re currently seeing can be put down to profits and how much down to wages (or indeed other factors like taxes).
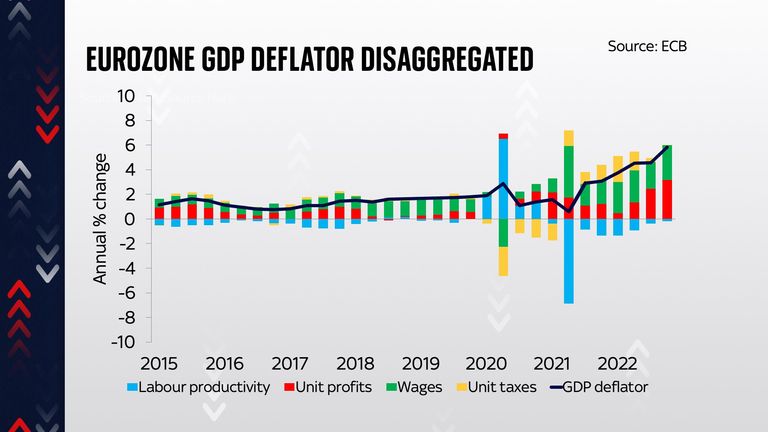
And the ECB chart is pretty stark:
The key thing to look at are the red slices of the bar. That’s showing you how much of the rise in prices in the past few years can be attributed to profits.
And it’s pretty clear that profits have been a considerable chunk of the recent increases in prices. Indeed, in the most recent couple of quarters of data, for late 2022, profits accounted for more of the rise in prices than wages (the green slices).
Now, some would argue that this isn’t necessarily profiteering. It’s simply businesses doing what they always do when there’s lots of demand for goods and raising their prices.
Without that response, the market as we know it simply wouldn’t function. Nonetheless, some say it underlines that a good chunk of the price squeeze is due to the greed of businesses.
So that’s the eurozone. How about the UK?
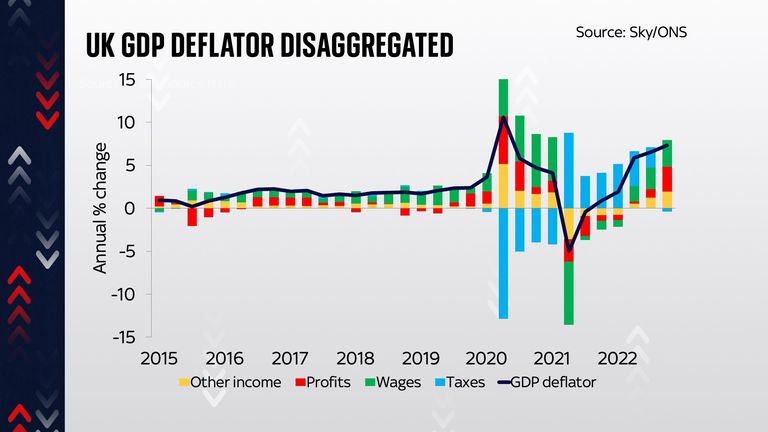
Well in the past few days we at Sky News have done a similar exercise to the ECB, using our own GDP deflator data to create our own ‘greedflation’ chart. And here’s what it shows:
A few obvious things leap out. The first is that enormous spike in prices and then the fall during COVID and its aftermath.
As far as I can tell this was in large part a function of the fact that wider measures of the economy were all over the shop.
It’s quite hard to know how much to read into anything going on during this yo-yo as for all we know it could be a statistical aberration (perhaps worthy of some further study).
But now look at the red slices. While the slice is certainly pretty big in the very latest quarter for which we have data (the final quarter of 2022), even in that quarter profits were still slightly smaller as a component part of the GDP deflator than wages.
And look a little further back and actually the contribution of profits to prices was far, far smaller than in the eurozone.
In other words, if this is our best statistical measure of ‘greedflation’ – and it seems to be – then we have considerably less of it here in the UK than there is on the other side of the Channel.
Tempting as it is to blame businesses for what we’re suffering through, there’s not an enormous amount of evidence from these figures that they are the main culprit. Actually, taxes (in other words the government) contributed much more to inflation in 2021 and into 2022 than business profits.
Now, with Britain facing double-digit inflation, a miserable cost of living crisis and rising interest rates, the above might not be of much consolation. And it’s quite possible the numbers may well shift – note that these figures are a little slow to be updated, so we don’t know the picture as of the early part of this year.
Even so, it’s a reminder that the data sometimes tells a subtly different story to the mainstream narrative.


